Tecsys Reports Record Revenue for the Third Quarter of Fiscal 2024
SaaS Revenue soars 48% in the third quarter, SaaS RPO reaches $157 million
Montreal, February 29, 2024 — Tecsys Inc. (TSX: TCS), an industry-leading supply chain management SaaS company, today announced its results for the third quarter fiscal year 2024, ended January 31, 2024. All dollar amounts are expressed in Canadian currency and are prepared in accordance with International Financial Reporting Standards (IFRS).
“Our third quarter represents another record quarter led by SaaS revenue and included the addition of five new logos, three new hospital networks, ongoing customer SaaS migrations, and the biggest bookings quarter of the fiscal year so far,” said Peter Brereton, president and CEO of Tecsys. “Our SaaS margins continue to expand and the resulting impact on our overall margin profile is becoming evident. We are seeing activity across all key verticals and through all commercial channels, with rising demand and pipeline expansion. This solid financial performance is bolstered by a market that is showing no signs of slowing down.”
Mark Bentler, chief financial officer of Tecsys, added, “After our third quarter we embarked on a strategic restructuring designed to improve profitability over the long term. As part of this effort, we reduced our workforce by about 4% across a range of departments. This restructuring is expected to result in one-time costs of around $2.3 million, which will be recorded in our Q4 fiscal 2024 financial statements and result in anticipated annual operating cost savings of around $4.6 million heading into fiscal 2025.”
Third Quarter Highlights:
- SaaS revenue increased by 48% to $14.2 million, up from $9.5 million in Q3 2023.
- SaaS subscription bookingsi (measured on an ARRi basis) decreased by 17% to $4.9 million, compared to $5.8 million in the third quarter of fiscal 2023.
- SaaS Remaining Performance Obligation (RPOi) increased by 23% to $157.2 million at January 31, 2024, up from $128.3 million at the same time last year.
- Annual Recurring Revenue (ARRi) at January 31, 2024, was up 16% to $87.2 million compared to $75.4 million at January 31, 2023.
- Professional services revenue was down by 4% to $13.0 million compared to $13.6 million in Q3 fiscal 2023.
- Total revenue excluding hardware revenue was $36.2 million, 11% higher than $32.5 million reported for Q3 last year, while total revenue rose 13% to reach a record $43.8 million.
- Gross margin was 45%, compared to 44% for the same period of fiscal 2023.
- Total gross profit increased to $19.9 million, up 17% from $17.0 million in Q3 fiscal 2023.
- Operating expenses increased to $18.7 million, higher by $2.7 million or 17% compared to $16.0 million in Q3 last year.
- Profit from operations was $1.2 million, up from $1.0 million in the same period of fiscal 2023.
- Net profit was $0.8 million or $0.05 per share on a fully diluted basis in Q3 fiscal 2024, compared to net profit of $0.9 million or $0.06 per share for the same period in fiscal 2023.
- Adjusted EBITDAii was $2.6 million compared to $2.8 million reported in Q3 last year.
- In the third quarter of fiscal 2024, Tecsys acquired 50,400 of its outstanding common shares for $1.5 million as part of its ongoing normal course issuer bid.
Year-to-date performance for first nine months of Fiscal 2024:
- SaaS revenue increased by 43% to $37.7 million, up from $26.3 million in the same period of fiscal 2023.
- SaaS subscription bookingsi (measured on an ARRi basis) decreased by 16% to $10.5 million, compared to $12.5 million in the same period of fiscal 2023.
- Professional services revenue was $40.8 million compared to $40.7 million in the same period of fiscal 2023.
- Total revenue excluding hardware revenue was $105.4 million, 12% higher than $94.4 million reported for the same period of fiscal 2023, while total revenue rose 14% to reach $127.3 million.
- Gross margin was 45% for the first nine months of fiscal 2024 compared to 44% for the same period in fiscal 2023.
- Total gross profit increased to $57.8 million, up 19% from $48.4 million in the same period of fiscal 2023.
- Operating expenses increased to $55.2 million, higher by $8.9 million or 19% compared to $46.3 million in the same period of fiscal 2023.
- Profit from operations was $2.6 million, up from $2.2 million in the same period of fiscal 2023.
- Net profit was $1.6 million or $0.11 per fully diluted share, flat compared to the same period in fiscal 2023.
- Adjusted EBITDAii was $6.8 million compared to $7.0 million reported in the same period of fiscal 2023.
“Based on our Q3 results and our Q4 outlook, we are revising our full year fiscal 2024 guidance to tighten the range on total revenue growth, tighten the range and increase the high end on SaaS revenue growth and tighten the range on short-term Adjusted EBITDA margin guidance,” continued Bentler. “We expect to provide updated guidance for fiscal 2025 as part of our Q4 and full year fiscal 2024 earnings release.”
Financial Guidance:
Tecsys is revising financial guidance as follows:

On February 29, 2024, the Company declared a quarterly dividend of $0.08 per share to be paid on April 11, 2024, to shareholders of record on March 21, 2024.
Pursuant to the Canadian Income Tax Act, dividends paid by the Company to Canadian residents are considered to be “eligible” dividends.
i See Key Performance Indicators in Management’s Discussion and Analysis of the Q3 2024 Financial Statements.
ii See Non-IFRS Performance Measures in Management’s Discussion and Analysis of the Q3 2024 Financial Statements.
Third Quarter Fiscal 2024 Results Conference Call
Date: March 1, 2024
Time: 8:30am EST
Phone number: 800-935-9319 or 416-981-9016
The call can be replayed until March 8, 2024, by calling:
800-558-5253 or 416-626-4100 (access code: 22029167)
About Tecsys
Since our founding 40 years ago, much has changed in the realm of supply chain technology. But one thing has remained constant; by developing dynamic and innovative supply chain solutions, Tecsys has been equipping organizations for growth and competitive advantage. Serving healthcare, distribution and converging commerce industries, and spanning multiple complex, regulated and high-volume markets, Tecsys delivers warehouse management, distribution and transportation management, supply management at point of use, and retail order management, as well as complete financial management and analytics solutions.
Tecsys’ shares are listed on the Toronto Stock Exchange under the ticker symbol TCS. For more information on Tecsys, visit www.tecsys.com/en-ca
Contact
• Public Relations: Adam Polka adam.polka@tecsys.com
• Investor Relations: investor@tecsys.com
• General Information: info@tecsys.com
• By Phone: (514) 866-0001 or (800) 922-8649
Forward-Looking Statements
The statements in this news release relating to matters that are not historical fact are forward-looking statements that are based on management’s beliefs and assumptions. Such statements are not guarantees of future performance and are subject to a number of uncertainties, including but not limited to future economic conditions, the markets that Tecsys Inc. serves, the actions of competitors, major new technological trends, and other factors beyond the control of Tecsys Inc., which could cause actual results to differ materially from such statements. More information about the risks and uncertainties associated with Tecsys Inc.’s business can be found in the MD&A section of the Company’s annual report and the most recently filed annual information form. These documents have been filed with the Canadian securities commissions and are available on our website (www.tecsys.com) and on SEDAR+ (www.sedarplus.ca).
Copyright © Tecsys Inc. 2024. All names, trademarks, products, and services mentioned are registered or unregistered trademarks of their respective owners.
Non-IFRS Measures
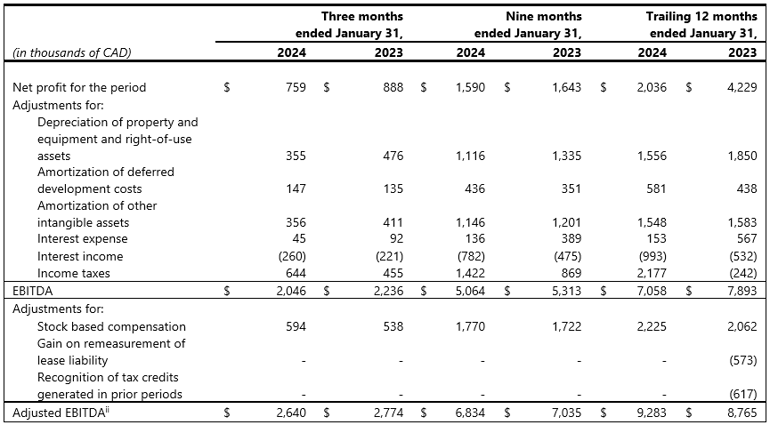
Reconciliation of EBITDA and Adjusted EBITDA
EBITDA is calculated as earnings before interest expense, interest income, income taxes, depreciation and amortization. Adjusted EBITDA is calculated as EBITDA before stock-based compensation, gain on remeasurement of lease liability and recognition of tax credits generated in prior periods. The exclusion of interest expense, interest income and income taxes eliminates the impact on earnings derived from non-operational activities, and the exclusion of depreciation, amortization, share-based compensation, gain on remeasurement of lease liability and recognition of tax credits generated in prior periods eliminates the non-cash impact of these items.
The Company believes that these measures are useful measures of financial performance without the variation caused by the impacts of the items described above and that could potentially distort the analysis of trends in our operating performance. In addition, they are commonly used by investors and analysts to measure a company’s performance, its ability to service debt and to meet other payment obligations, or as a common valuation measurement. Excluding these items does not imply that they are necessarily non-recurring. Management believes these non-GAAP financial measures, in addition to conventional measures prepared in accordance with IFRS, enable investors to evaluate the Company’s operating results, underlying performance and future prospects in a manner similar to management. Although EBITDA and Adjusted EBITDA are frequently used by securities analysts, lenders and others in their evaluation of companies, they have limitations as an analytical tool, and should not be considered in isolation, or as a substitute for analysis of the Company’s results as reported under IFRS.
The reconciliation of EBITDA and Adjusted EBITDA to the most directly comparable IFRS measure is provided below.
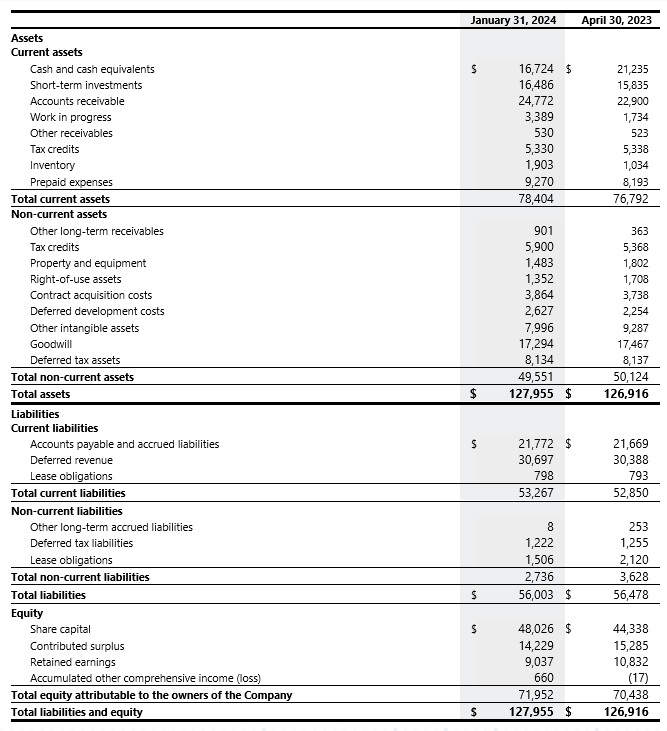
Condensed Interim Consolidated Statements of Financial Position
As at January 31, 2024 and April 30, 2023 (Unaudited)
(In thousands of Canadian dollars)
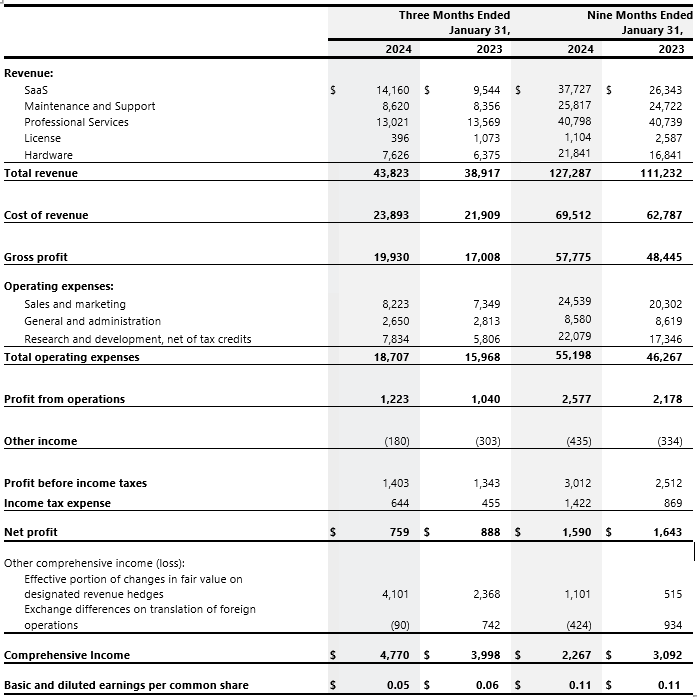
Condensed Interim Consolidated Statements of Income and Comprehensive Income
For the three and nine-month periods ended January 31, 2024 and 2023 (Unaudited)
(In thousands of Canadian dollars, except per share data)
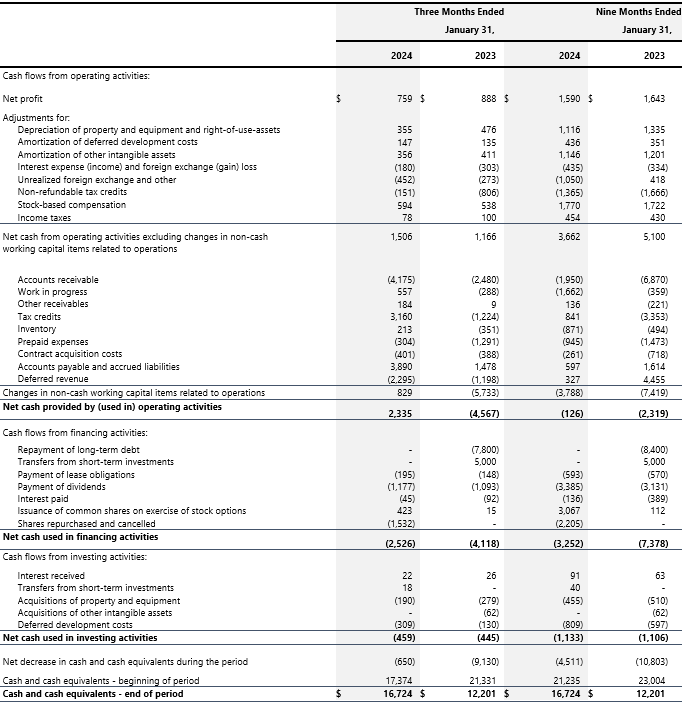
Condensed Interim Consolidated Statements of Cash Flows
For the three and nine-month periods ended January 31, 2024 and 2023 (Unaudited)
(In thousands of Canadian dollars)
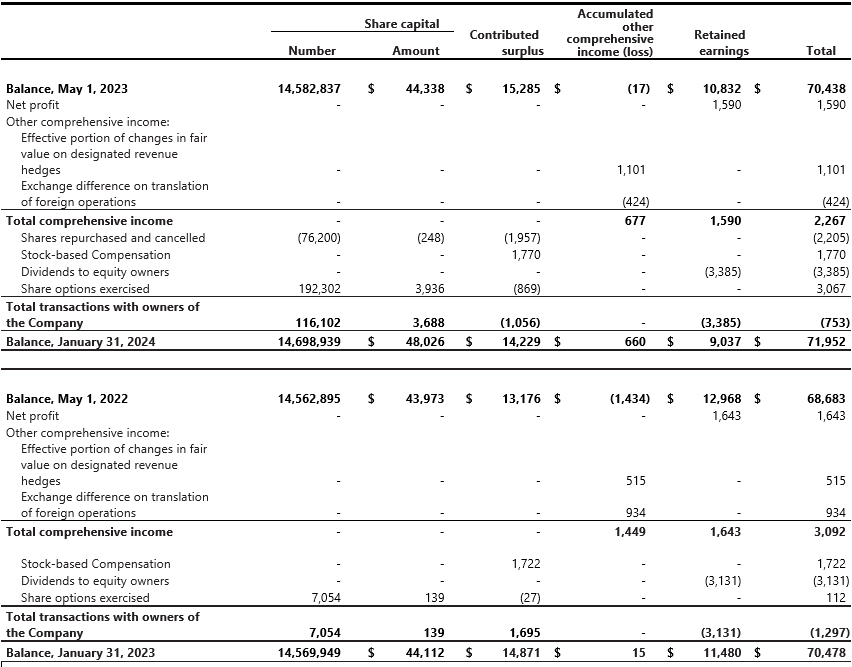
Condensed Interim Consolidated Statements of Changes in Equity
For the three and nine-month periods ended January 31, 2024 and 2023 (Unaudited)
(In thousands of Canadian dollars, except number of shares)
